This page is now considered outdated as the information has not been updated in sometime and is no longer relevant to the current Davis systems. This page has been left as a reference page in our ‘Legacy’ section.
Introduction
Modern weather-station software can generate impressive presentations of weather data on both local displays and on web pages. This page includes some brief introductory notes on the different types of display that can be created and then the screenshots further below provide a wide range of examples.
The screenshots shown are generated by various weather programs compatible with the Davis stations and show local PC displays as a first type and then, further below, webpage displays. Even this varied selection is just a sample of the of the available displays – there are many compatible programs nowadays; each is able to show the data in several layouts; and there is scope for more variety because some webpage displays can be used in combination with more than one source program.
As a first illustration of what’s possible, the live webpage example below (of current weather at our workshop at Ely in East Anglia (UK); this display should update automatically every 5 minutes) is easily created without specialist knowledge and at relatively low cost. This particular example uses the Davis 6555 WeatherlinkIP data logger uploading automatically to the central server site at www.weatherlink.com. Most users will very readily be able to recreate this sort of data presentation on their own websites, but see below for illustrations of many other options.
The basics of creating PC and webpage displays
The weather station needs to have a PC interface or data logger, which will, typically, be cabled to a PC for processing by software running on that PC. (The main exception is provided by loggers that can connect directly to a network without needing a local PC, such as the WeatherlinkIP logger – these provide the simplest possible way of presenting live weather data on a website – see image above – but inevitably with some limitations in how flexibly the data can be presented.) Most of the screenshots below are generated by PC software and not by network-connected loggers.
We’ve divided these examples into two groups: those as viewed locally on the PC linked directly to the weather station, and those that are designed to be used on a website. (NB The website-type displays simply present their weather data in web pages, which can be viewed from anywhere. There is absolutely no reason why a webpage display cannot be viewed locally as well – potentially without uploading to a remote web server if you don’t wish to do so. So the webpage displays can be used perfectly well to distribute weather data around a local/private network, eg within a building or site.)
These two types of presentation often end up looking very different because different software techniques are often used to display data on a web page compared to those commonly used on local PC displays. Sometimes, completely separate programs written by different designers are used to generate the website displays and so personal designer preferences can also account for major differences in the look of a given presentation. Finally, website displays may be constrained by the amount of data that can be uploaded to the website and by how often it’s practicable to run an upload. That said, there are ways of updating even website displays essentially in real time but these need special add-on software programs, as detailed below. So, in practice, local and website displays can look very different.
How much configuration or webpage design work is needed to create one of these data presentation will vary. Many of the features and options are available more or less ‘out of the box’ by use of built-in presentation formats for a local display or templates for web pages. But for other, more specialist projects, especially for more sophisticated web page designs, some straightforward development work may be needed. But if you can’t see exactly what you’re looking for in the examples here, then please get in touch and we’ll do our best to advise.
With this background, the following section shows a number of examples of compatible software and illustrates both the range of data presentations available and the specific presentations generated by different programs. Please remember that there’s only space here for a few representative examples – a more comprehensive review could fill almost a whole website.
Local PC Data Presentations
Please note: The images below are reduced in size somewhat from the originals – please click on an image to see it in greater detail and in a new window (but note that even this larger image will still not necessarily be the full-sized image visible on a high resolution monitor and so will not reflect the full detail and clarity of the actual display). Also, these local display examples can only be static images – we have no way of showing a live local display on this webpage; however, several of the dedicated webpage displays further below will have links to live displays.
There are many ways of viewing the weather data with a local PC – for example the display may be text-only or graphic and may relate to the latest real-time data or to summary data over a period such as a calendar month. This section aims to illustrate the range of local displays that are usually possible and includes examples from two distinct programs: the Davis Weatherlink software supplied free with each logger, and the free Cumulus software. A number of further programs are available such as Weather Display, Virtual Weather Station and several others, which will broadly have a similar range of capabiltiies.
 Real-time display (graphical) – This is an example of the Davis Weatherlink program’s ‘Bulletin’ screen. This screen updates every 2 seconds or so and at each update the wind direction (top left) and wind speed (top right) dials will flick to show the latest wind readings. (NB The exact format of this screen will vary according to the sensors fitted, eg this example shows displays from the optional solar and UV sensors – bottom left and right.)
 ScreenReal-time display (text) – This is an example of the Weatherlink’s Summary screen, which updates in real time and shows current readings for all main weather parameters, including – where relevant – high and low values for today so far. Some additional information such as mean wind speeds over four different intervals plus forecast and calendar data is also shown. As with all Weatherlink screens, the exact screen format will depend on the sensors types installed.
 Combination Real-time and Historic Data presentation. (No larger image available) This is an interesting data presentation from the Cumulus software that combines three features:
- Cumuls real-time screenText display of current conditions (updating every few seconds);
- Text display of ‘historic’ conditions (eg those from yesterday;
- Graphical presentation of wind data;
 Monthly summary (text) – An image of a PDF document produced by the add-on program Weatherlink Reporter that shows summary day-by-day data for a user- selected set of weather parameters over one complete calendar month.
 Summary chart (graphical) I – Cumulus (No larger image available) . These summary charts provide a visual method of reviewing weather conditions over a period such as a week or month. Depending on the specific program in use, it’s usually easy to switch between different weather parameters and time periods with a couple of mouse clicks.
 Summary chart (graphical) II – Weatherlink Plot Mode This is a similar presentation to the monthly Cumulus chart above, but from a different program. Plot mode is one of the five main local PC modes of the standard Davis Weatherlink software. This charting mode is notable for its flexibility in easily being able to overlay different parameters and to select different time periods for review. Its presentation is clear and plain rather than Powerpoint ‘fancy’.
Website Live Data Presentations (also available to networked PCs not directly linked to the AWS logger)
Definitions: With web page presentations there is a key consideration about how often you wish the presentation to update automatically (for displaying live weather data as opposed to static historical data for eg last month).
For standard HTML pages the maximum update frequency routinely achievable in practice is around once per minute. However, one update per minute is not sufficient to show live wind data, which requires updates every 2-3 seconds to display individual wind gusts accurately. (And, since wind is the only weather parameter that typically changes on a time-scale of seconds, if you’re not seeking to show live wind data then updates say every 5 minutes are often enough to show live weather conditions with reasonable accuracy while making much less demand on upload bandwidth, server response etc.)
It is possible to show live wind data on a website with updates as often as every 3 seconds, but this requires a move away from traditional HTML web pages to special add-on software techniques that use Flash or Silverlight or HTML5. With these techniques, the generation of the visual data presentation is all handled in the user’s web browser with relatively only very small amounts of data needing to be uploaded to the web server at every update – the browser does the work of generating the display and not the source PC or web server.
So for web page presentations we recognise two distinct categories of display:
- Real-time displays, which will update on a timescale of seconds. These displays need special software such as Steelseries Gauges (HTML5), Cumulus Real-time (Silverlight) and Weather Display Live (Flash) which are add-ons to the main weather processing software;
- Current conditions displays, which use traditional HTML web pages and are typically set to update at 1, 5 or 10 minute intervals;
Check the caption beside each example to see whether it is ‘real-time’ or ‘current conditions’ in nature. Note that the ‘real-time’ examples will take a few seconds to load initially, but are then worth watching for a minute or two to see the real-time data change – especially wind speed and direction (assuming it’s not calm!). Hovering the mouse over some gauges will often display further graphical information too.
All but the last example below are images – click on the image to open a new window with live weather data. (NB You may need to resize the new window to see the full display. Also, if you don’t have the appropriate technologies installed on your PC such as Flash and Silverlight then you won’t be able to see the live data feeds – most PCs do now have them installed as standard.) For the final weatherlink.com example (as in the first image on this page above), the live data is embedded in this current web page – using an iframe mechanism – as a demonstration of how this can be achieved.
A notable feature of some (but not all) of the web page displays is that they are user-configurable. What the originating program generates are the individual elements of the display – a single gauge for example – and the web page owner can then customise the layout and appearance of the elements according to their own preferences. This is why web pages using the same underlying software can look distinctly different from one another.
 Real-time display (graphical) I – Weather Display Live (WDL) This is the most popular of the real-time web programs and takes a data feed from the Weather Display (WD) software. Despite the overlap in names, WD and WDL are two quite separate programs, written by different designers, but working in harness. WD runs locally on a PC linked to the weather station to generate the data feed in a specific format while WDL is uploaded to the web environment to create the final visual display in the user’s browser.
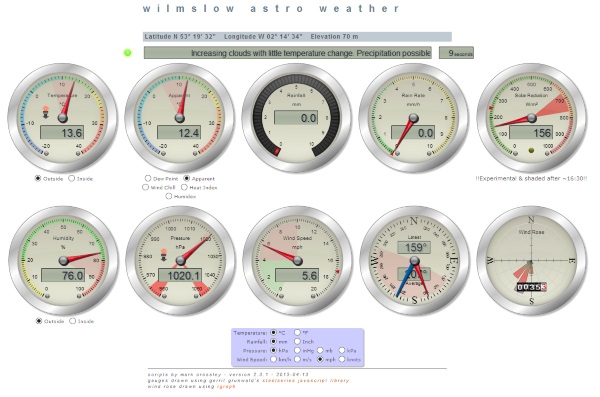 Real-time display (graphical) II – Steelseries Gauges This is an example of the latest type of graphical front-end, written for HTML5 Canvas and coded in JavaScript. It is another illustration of the model where the front-end display is quite separate from (and independently written) the program that provides the weather data feed. This set of scripts is open source (hence free to download and use) and is currently compatible with both Cumulus and Weather Display. Remember to hover over some of the gauges for further information.
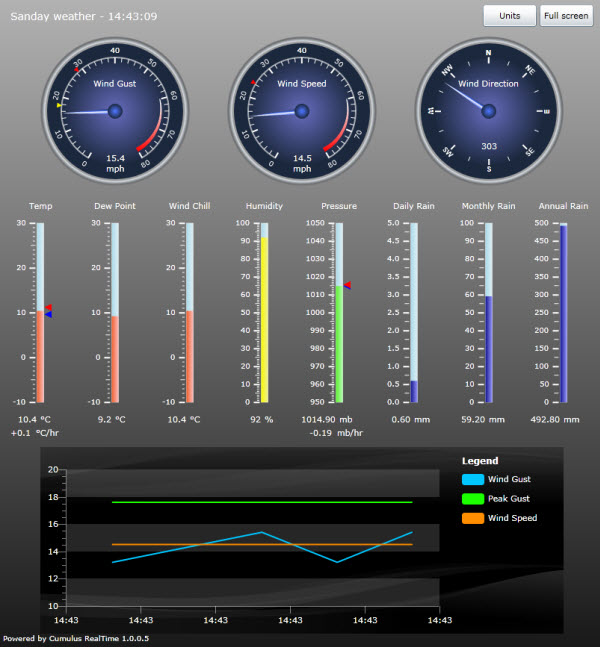 Cumulus Real-time ScreenReal-time display (graphical) III – Cumulus This is a further take on the real-time theme and uses Microsoft Silverlight as the enabling real-time technology rather than Adobe Flash as used by WDL above. In the Cumulus software both the local program and the real-time add-on come from the same software design house.
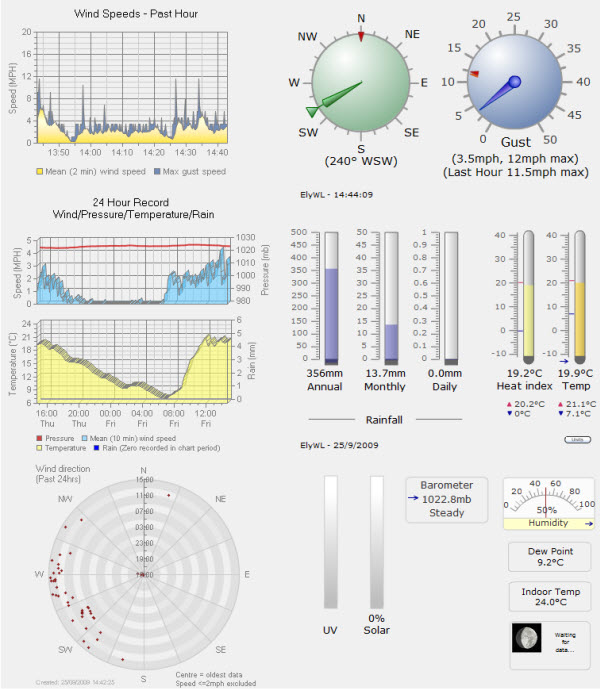 Real-time display – enhanced (graphical)– www.elyweather.co.uk This example is taken from our own local weather website and illustrates two features. First, it shows how custom extensions to an underlying data presentation can be made. In this case, we’ve taken the WDL display (see above) as a starting point and added some trend graphs of our own in the left-hand column. And, second, it illustrates how even though we’re using the same WDL program as above, by changing the selection, layout and styling of the displayed elements, it’s possible to achieve a significantly different look. (NB This example is only intermittently live at present, but is left as an illustration.)
 Current conditions display (full) This is an important example because it shows the standard web page display possible with the Davis Weatherlink software that is supplied free with every Davis data logger. Anyone using this program can generate this web page display after just an hour or two’s work to set up and test the installation. It’s also noteworthy as an illustration of how it’s possible to mix three types of element in the overall display:
- Text values, including highs and lows, in the left-hand column;
- A visual representation of current weather values in the ‘tank’ graphics, such as temperature;
- Trend graphs to show certain readings changing with time as in the barometer trace;
NB This example (and those below) is a ‘current conditions’ display rather than real-time and so updates eg every 5 minutes.
Current conditions display (text) – This is an example of the summary screen available from the weatherlink.com website which is uploaded to by the special WeatherlinkIP data loggers and is the companion screen to the graphical current conditions display included close to the top of this page. It illustrates how even simple text can still be a powerful way of displaying current weather conditions, as well as providing high and low values for today so far for a variety of weather parameters. The example below should be showing live data and so also illustrates how it is possible to embed live data in your own web page (via an HTML iframe).
Current conditions display (enhanced text) – See image with the blue-sky background from the Weatherlink.com website close to the top of this page.
- [Any of the local PC displays showing summaries over a defined period (eg monthly) can obviously also be copied up to a website/network display, but because these are typically generated interactively with user input and not automatically, they’re not in the same category as the preceding four website options, which all upload and update automatically.]