EM Hardware Components
The EM system is based around three types of hardware component: gateways, nodes and sensors.
Gateway
An EM Gateway is the link between the local site and the Weatherlink cloud platform. The local gateway receives data from all nodes within wireless range and uploads data across the mobile phone network to the central Internet platform at weatherlink.com .
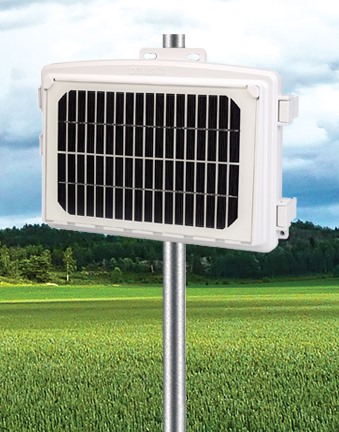
Wireless gateways seem to use the same case and solar power supply as Vantage Connect units and so look superficially identical, though of course with different internals. One gateway can receive data from 20 or more nodes, subject to wireless range limits.
Communication between gateway and nodes is via a ZigBee wireless mesh, working in similar frequency bands to the existing Davis wireless systems (i.e. 900MHz band for N America and 868MHz elsewhere), but the EM protocol is not compatible with the Vue/VP2 protocols and wireless components cannot be intermixed between the two systems.
The ZigBee mesh principle has two important features:
- The same wireless protocol is used to communicate from node to gateway and from node to node;
- In a configuration that uses multiple nodes, an intermediate node can act as a repeater for a more distant node – no need therefore for separate repeaters. And if a distant node has more than one path through intermediate nodes to the gateway then the mesh will automatically fail over to an alternate path if a node should ever go offline;
Node-to-node distance is potentially up to 600m line-of-sight under ideal conditions, but it’s probably better to work with a preferred maximum of 300m in practice.
If an EM installation is specified to include weather sensors then this is currently achieved by using a cabled VP2 ISS wired direct to a gateway – an ISS is the only sensor type to link to a gateway (and ISS units can only be connected to a gateway and not to a node).
Nodes
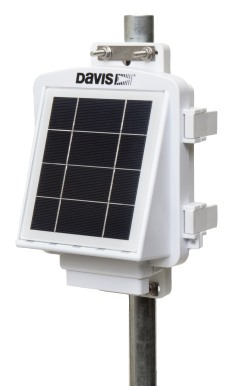
Each node communicates with other nodes and its gateway as described above. Each node is able to accept up to four sensors of various types, each being wired into the node. The extensive range of compatible sensors is described below.
The sensor configuration for each node is uploaded to it via Bluetooth from the EM smartphone app whenever a new node is installed or reconfigured.
The node is one of the innovations in the EM range, being fully self-powered by 3W solar panel and lithium-ion battery pack and using an intermediate form factor.
Sensor connections into the node can be made with either bare conductor connections or using an adapter that accepts RJ11 plus from sensors such as Davis temperature and temperature/humidity sensors.
Sensors
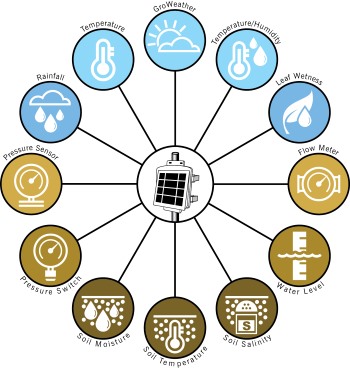
A wide variety of EM-compatible sensors is available, including weather, soil and various additional types of pressure/flow/level sensor and sourced both from Davis and from many other manufacturers. Sensors other than ISS units must all be wired to a node.
The list of node-compatible sensors includes all Davis supplementary sensors (except ISS units and anemometers). In addition, a wide range of soil-monitoring sensors from other manufacturers has been tested and approved, as have sensors for water level and irrigation monitoring.
EM is designed to be adaptable in principle to additional sensor types (provided these are electrically compatible with the EM node interface) and so we fully expect that still more sensors will be approved for use in the future
EM Data Handling
Overview
EnviroMonitor communicates with the outside world in two ways:
- An EM Gateway uploads data via the mobile phone network to a fully-featured, modern, cloud-based data platform at Weatherlink.com (for EM). Various devices, including e.g. smartphones, tablets and PCs, can then access the data across the Internet using either a standard web browser or smartphone apps;
 EM Gateways and Nodes can talk to the smartphone app called ‘EnviroMonitor’ via a local Bluetooth connection. This EnviroMonitor app is used primarily for configuring the Gateway and Nodes when onsite with the system and for associated maintenance tasks such as updating firmware in the units. But this app can also be used for remote viewing of EM system health-check readings.
EM Weatherlink now stores all historical archive data in the cloud, removing the need to store and process this data locally (although data downloads are still possible, if required).
See below for further details.
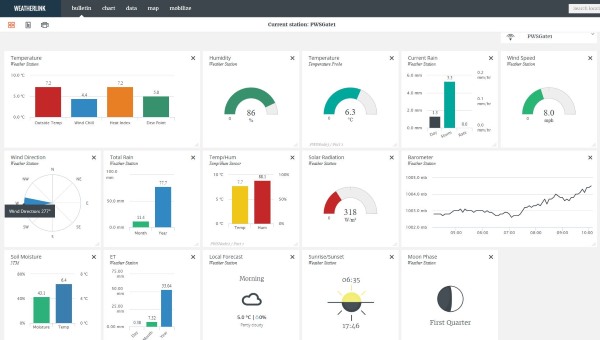
EM web interface
The web interface for EnviroMonitor provides comprehensive access to all readings and settings. It represents a major upgrade for how Davis presents data online and seems well designed to cater for the myriad combinations of gateways, nodes and sensors that an EM system could possess.
The web interface should be viewable on any device with a standard web browser and is of course accessible from anywhere in the world with an Internet connection. (Users of devices with a small display area like smartphones might prefer to use the custom EM smartphone apps as an alternative.)
The main EnviroMonitor web page is essentially a dashboard that displays – in graphic form, by default – all of the enabled readings from sensors visible to the station’s primary Gateway, plus a set of menus that provide access to all the other features and settings. This current-readings area is called ‘Bulletin’ my analogy with traditional Weatherlink, but is redesigned out of all recognition with the previous version. The new Bulletin display is a tiled/graphic design that has considerable customisability.
There’s not space here to provide anything other than a brief listing of the main features of the web interface along with some example screenshots, but the principal features include:
- Current readings in graphical or text format (including max/min data);
- A highly flexible Chart module;
- A new Mobilize module that provides recent readings AND forecast estimates for 3-4 days ahead of e.g. weather and soil parameters that may be critical to the success of certain crops, e.g. frost or weather or irrigation warnings;
- A spreadsheet-like view of any selected block of Data (cf Browse mode in ‘old’ Weatherlink);
- A world map of installed EM stations;
- Access to all of the account and configurational settings of the EM system, including various Alarm thresholds and Notification settings
Please contact us if you need more specific information on any aspects of the EM data handling.
EM Smartphone apps
There are two distinct smartphone apps for use with EM systems – EnviroMonitor and Mobilize. Both apps are available in both iOS and Android versions and should be free downloads from the Apple app store and Google Play store respectively. The two apps serve quite distinct purposes, as described below:
EnviroMonitor app
![]() The EnviroMonitor app is used primarily for configuring the Gateway and Nodes when onsite with the system and for associated maintenance tasks such as updating firmware in the units. But this app can also be used for remote viewing of health-check readings for EM installations.
The EnviroMonitor app is used primarily for configuring the Gateway and Nodes when onsite with the system and for associated maintenance tasks such as updating firmware in the units. But this app can also be used for remote viewing of health-check readings for EM installations.
When onsite, the smartphone hosting the EM app establishes a Bluetooth connection with the individual Gateway or Node, which then allows configuration of the sensor inputs and the overall EM installation, and also permits e.g. updating of the unit’s firmware. The EM app is intelligent enough to provide detailed wiring information for individual sensor types and installation instructions.
When using the EM app remotely, users can check various operational readings such as battery voltage (the remote units being solar-powered) and various wireless reception parameters. So a complete health-check on an EM installation is possible from anywhere in the world.
Mobilize app
![]()
The Mobilize app is dedicated to providing information and alerts for specific practical situations. These may be weather-related, e.g. a general warning of potential frost or wind damage or the possibility of irrigation being needed, or customised to a particular crop type.
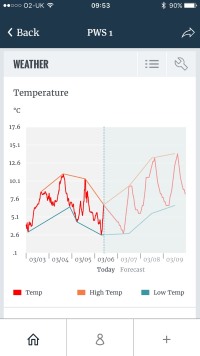
Information is presented by Mobilize in two ways: either as text readings or as a 7-day chart. A notable chart feature is that it provides a 3-4 day forecast of key parameters such as temperature and rainfall.
Mobilize is the app to which users are most likely to turn to when out and about because it provides a snapshot of current weather readings on their smartphone, along with alerts of possible adverse conditions over the next day or two.