This page is now considered outdated as the information has not been updated in sometime.
Weatherlink loggers
Linking a Davis station to a computer is usually a straightforward process that typically requires the Davis Weatherlink logger option; the contents of the Weatherlink pack are described in more detail in the Weatherlink page of our Buying Guide so we’ll restate only a few details here. Weatherlink consists of two main parts: a data logging module and a comprehensive software program. The data logger attaches to a special connector on the weather station console and its output connects to a standard USB port on a computer (other logger versions are also available as options). The logger’s main function is to act as an always-on intermediate data store between console and computer that can, for example, store up to several weeks worth of data while the linked computer may be switched off. (Indeed in some applications such as monitoring weather conditions in an isolated field site, the logger may be permanently disconnected except when a laptop may be connected briefly to download the most recent accumulated weather readings.)
Davis Logger & Software Topics
Handling weather data on PCs & websites is covered extensively on this site – here are some links to related PC and website topics (current page is shown unlinked):
Overview of loggers & software;
Advice on PC linking
Introduction to live weather websites
Advice on weather websites
Details of the Weatherlink product
Summary of compatible software;
Various advanced topics
We’re going to use the Davis Weatherlink software as an example to illustrate the range of extra features that PC-linking makes possible, apart from any other consideration a free copy of the Weatherlink program is provided free with every logger. But there is a wide choice of alternative software such as Cumulus and Weather Display — see the short section at the foot of this page on Weatherlink vs other software packages. Miniature computers of various kinds such as the Raspberry Pi and MeteoBridge can also be used in place of the more familiar standard PC or laptop – these options are described in the Choosing a Weather PC topic.
The Davis Weatherlink program possesses a large number of features, which overall provide six main capabilities:
- Maintaining a permanent and detailed record of all weather data;
- Displaying current weather conditions in an impressive graphical presentation;
- Reviewing past weather in graphical form;
- Generating monthly and yearly statistical reports;
- Running a live weather reporting website;
- Providing a feed of weather data for other programs;
Each of these software capabilities is discussed further below.
Main Weatherlink Software features
Permanent weather record
A backstage feature, but a crucially important one: The Weatherlink software maintains a permanent, detailed, hard-disk archive of all weather data logged by Weatherlink since the system was first switched on, organised into separate monthly files for ease of backup and scaling. This archival database provides the data for all retrospective analyses and graphs and, over time, becomes a vital and immensely detailed library of all your local weather records. Any day’s data – potentially years after the event – can be called up from the database and reviewed in detail.
Current weather display
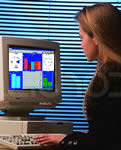
 The Bulletin is Weatherlink’s mode for providing a graphical display of current weather conditions and is probably the most well-known ‘face’ of the Weatherlink software. (Click thumbnail at right to see the image full-size.) Latest readings from all of the standard sensors, including solar and UV sensors if fitted but omitted if not, are shown graphically to give a snapshot of the latest weather conditions. The display also includes various additional readouts including:
- Derived readings such as dew point and wind chill;
- Rainfall for multiple periods, including rainfall rate;
- A 6-hour trend graph for barometric pressure;
- A text forecast for the coming hours;
Review of past weather
 All of the weather data in the archive database is available for detailed inspection, either record by record in the text-based Browse mode or, as shown here, with the aid of the powerful Plot mode. Any combination of the logged data values can be shown plotted together over time-spans of hours, weeks, months etc. Here we see an excerpt (title, key etc are normally visible) showing maximum wind speed (left axis – mph – red); rainfall (right axis – inches – blue bars) and pressure pattern (black) for the month of March 2004 at our base.
Monthly and yearly statistical reports
 A range of periodic (eg monthly and yearly) text-based reports and summaries can be created, with appropriate statistical analyses. This reduced-size extract shows day-by-day temperature, rainfall and wind data for the first 10 days of March 2004. Highs and low values for each parameter are shown, where relevant, along with times of occurrence. Various related indices such as the ‘growing degree days’ value used in agriculture may readily be calculated also.
Live weather reporting website
Built into the Weatherlink software are all the features needed for running your own, automatically-updating, weather reporting website on the Internet, which can be viewed by anyone around the world. But don’t overlook the fact that webpages are just as effective for distributing current weather data around a local area network and, for example, allowing a number of different people in the same building to view the latest weather data.
Setting up the website is straightforward for anyone with a modest familiarity with Windows software. You can choose from a range of pre-designed web page layouts, or design your own layout and include just those weather readings and graphs you wish. Read more about setting up a Weatherlink website.
Data source for other programs
As you can see, the Weatherlink software provides a great many features to analyse and to present the weather data. But with such a wealth of detailed data available, sometimes users prefer to perform analyses in their own unique way or may have a specialist use for the data not covered by the standard software packages. For these applications, Weatherlink provides a menu option to export any contiguous dataset in a standard text format for input to eg a spreadsheet program such as Excel. Weatherlink can also be set to generate certain text-format data files automatically, which – with some further programming – can be used as a direct source of the latest weather data by other programs. See our Advanced Topics area for a more detailed discussion.
Other Weatherlink features
There are also a number of further Weatherlink features not included in the main list above. These include:
- The auto-updating Strip Charts mode, graphically showing current values and trends for multiple weather parameters;
- An auto-updating daily Summary text window, which keeps track of new highs and lows as each day develops;
- Virtually all settings of the weather station console may be controlled from the PC;
- The option of additional software modules for specialist tasks, eg in agricultural management and alarm messaging;
Weatherlink vs other software packages
We’ve obviously used the Weatherlink software as the example of weather station software here. There is also a thriving after-market in third-party programs compatible with the Davis stations that offer even more features – sample output from some of these programs can be seen on the data-handling introductory page. But the Weatherlink software is what’s included free in the Weatherlink pack; it’s therefore typically the software that most users first encounter and also one that many users are perfectly happy with. Other makes of station will have their own proprietary software, usually each with their own quirks, and cheap stations will generally have only cheap and limited software.
Advanced users
 Linking the weather station to a PC brings one other key benefit in that all the technologies available in modern PCs and networks for moving data around, potentially over long distances, can be applied to the logged weather data. While the simple standard station + PC installation will be perfectly adequate for many users, those interested in a more advanced configuration may wish to read our separate summary review of additional data handling options. Some additional information on operation of the data logger will be found in the Advanced Topics area.
Choosing a weather computer
For introductory purposes, we’ve assumed that the linked computer is a standard Windows PC since this is the commonest option; hence we use ‘PC’ as shorthand to refer to all types of computer. But stations can certainly be linked to other computer types, eg PCs running Linux or to Apple Macs, though at present the choice and capabilities of the available programs on other platforms are often limited compared to the equivalent Windows software. Purely for this reason we do suggest using a Windows PC if at all possible as the most straightforward option.
Small and cheap Linux-based computers such as RaspberryPi and MeteoBridge are starting to be more widely used and can offer an interesting and cheap alternative way of running a weather PC, albeit with some important limitations.
Where a computer is to be linked continuously to a weather station (perhaps to supply a data-feed to a weather website) it can make sense to use a dedicated weather PC. This need not be expensive either to buy or to run – a small low-power laptop PC is all that’s needed and need consume no more power than a low-energy light bulb. The topic of choosing a suitable dedicated weather PC is discussed in detail on its own page.(We will also be adding a separate page on using small Linux computers such as the Raspberry Pi in the near future.)