This page is now considered outdated as the information has not been updated in sometime and is no longer relevant to the current Davis systems. This page has been left as a reference page in our ‘Legacy’ section.
Listed below are links to various demonstration web pages that offer examples of novel ways in which weather data may be presented on a web page. This listing is intended to give examples of novel techniques and ideas that users can customise to their own particular requirements, so these are illustrations rather than universal templates. Also, this section is not meant as a catalogue of data presentations from commercial and shareware software packages – several examples of screenshots from the commonest packages are already provided on the data-handling introductory page – rather we’re aiming here to provide examples of how various standard web-page authoring techniques can be combined to create a powerful overall presentation of weather data.
It’s not difficult to get these more sophisticated web page presentations working on your own sites, but please be aware that they typically involve more than simple HTML coding – generally there’s at least a little basic JavaScript coding required as well. If you don’t feel confident with these techniques but have a project that might benefit from using these techniques then please feel free to contact us – we may well be able to quote a very cost-effective price for a custom implementation.
Tabbed webpage containers
There’s a common problem of ‘too much data’ in presenting weather data on a web page. Often there’s so much data available that it becomes overwhelming to view and so the key data items don’t shine through. Or – another common situation – there’s a need to present data from several different sources on the same page, which can potentially create the same problem of information overload.
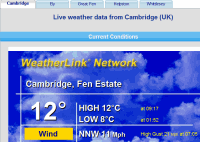 A tabbed container is one good solution to this problem with only the data from the active tab (for example, from one weather station out of several in a group) visible at any one time. This solution allows the user to take in one tab’s-worth of data at a time before clicking on a different tab to view another set of data. We currently have two examples of this tabbed-container approach:
- Data from multiple stations on a single web page:
- Comprehensive data from a single station but divided up into smaller and more easily presented & digested groups of data items. (This example yet to be uploaded);
Weather data linked to clickable map markers
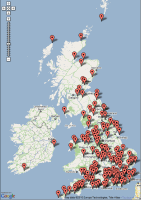 It often adds considerably to the value of a web page presenting weather data if the geographical location of the weather station generating the data can be pinpointed.
Where the data is from a single station then a small static map image can provide this information. But if data from multiple stations is being shown on the same web page then hyperlinking markers on the map to views of the data can be a powerful device to aid interpretation of the data.
How this is best done will depend on the nature of the sites and of the data. We currently have two examples here:
- If the data from each station is potentially in a different format for each station then the most straightforward option is to present the data from that station in a new browser tab or window. Every time a map marker icon is clicked, this will open a new view of that station’s data. This is the approach used on our well-known clickable map showing the location of many privately owned weather stations in the UK.
- But where each station’s data is available in a reliably predictable format then it’s possible to couple the map to the data view more tightly and more elegantly (because it’s then possible to reuse the same data container on the same web page for each station’s data). We have a good example of this approach on a special linked-data demonstration page.