Buy Now
Note: Parts of this page are significantly out of date and currently being rewritten. All of the information here is still valid but an updated overview will be available in the near future.
Introduction
Modern makes of automatic weather station like Davis make it easy to process the station’s weather data automatically by computer for viewing both on local computers and via the Internet in a standard web browser or smartphone app, and for long-term records-keeping.
Internet-based weather pages are obviously viewable from literally any location worldwide with Internet access, with obvious examples being when you are away from home or in an office wanting to view weather data at a remote site.
How far you take this process is very much up to you. Some users are content with keeping a detailed archive of their weather data on a local PC** for future reference. Others may prefer to take full advantage of the many features that modern software and web servers provide to create visually impressive, real-time presentations of their weather data on web pages that may be viewed from anywhere in the world. Tablets and smartphones can of course view data posted to web pages or in a format for their own apps, but typically do not process data directly from the weather station.
** ‘PC’ is just shorthand here for any type of compatible personal computer, including Windows PCs, Macs, Linux machines like a Raspberry Pi etc.
If you wish to use any of these PC or webpage-related features then you will typically need to add a data logger to the weather station itself (or an alternative upload device such as the new Weatherlink Live (WLL) unit, which functions similarly to a logger except that WLL is a standalone device receiving data direct from a wireless ISS) . In the Davis architecture, a Weatherlink data logger (or a compatible third-party logger) is essential to connect the weather station to a computer or network – you cannot connect the console unit direct to a PC. Note that the Davis logger is a true data logger and can store data for extended periods, for example while you’re away on holiday, for later download to a PC.
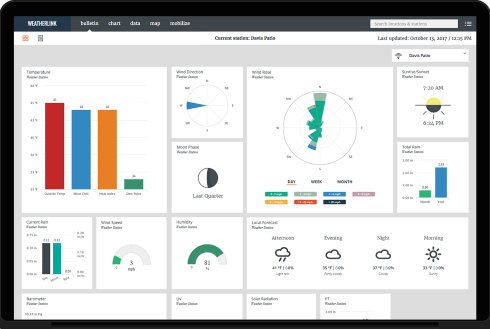
And, even if you’re not a PC expert, it can be relatively simple to make your weather readings available to the world on a web page. The adjacent image should be showing live weather readings (check the time and date!) from our workshop location and is easily achieved by connecting a Davis Weatherlink Live unit (or comparable device such as the console-fitting WiFi Logger) directly to your home network (no PC needed) and simply including the resulting image in your web page.
This image is an example of a presentation from the Davis Weatherlink Network 2.0. The same presentation can also be generated by using a free upload from as copy of the Davis Weatherlink v6 software running on a local Windows PC, or from a Vantage Connect or Enviromonitor units, as used for weather monitoring at a remote, unattended location.
This page provides a general introduction to the process and benefits of using data loggers with weather stations. There is also an introductory page specific to the legacy Davis Weatherlink logger, which you may wish to read in addition.
Additional notes
To be clear, you don’t have to connect a weather station to a PC – the built-in console display does provide a good snapshot of what the weather is doing right now, so if you’re allergic to PCs then you can still enjoy a lot of interest and value from a standalone weather station. But adding a data logger and PC or Internet connection to the system does add hugely to the station’s capabilities and so most customers nowadays do specify the logger option.
Enviromonitor and Connect stations: The notes here relate primarily to standard Davis Vue and VP2 weather stations. Davis also market an extensive range of stations in the Enviromonitor (EM) and Vantage Connect products, intended for installation at remote sites and with data transfer across across the mobile phone network. EM and Connect both send data direct to the Davis weatherlink.com platform and so don’t use loggers and local software as discussed here. But if you’re looking for a station for use at a remote site then don’t overlook the EM and connect products – these are often an excellent solution for remote applications.
In more detail
Davis Logger & Software Topics
Handling weather data on PCs & websites is covered extensively on this site – here are some links to related PC and website topics (current page is shown unlinked):
Overview of loggers & software;
Advice on PC linking
Introduction to live weather websites
Advice on weather websites
Details of the Weatherlink product
Summary of compatible software;
Various advanced topics
This overall topic of data logging and software for our automatic weather stations is a big one with many options and alternatives. For readers interested in a more detailed description, various topics are covered in different places on this website – see the box to the right for a guide on where to find the relevant pages. In particular, this related page in our Advice section offers a more detailed overview of the summary on this page and with more of a focus on choosing a weather computer and logger to work together.
The Davis weather stations range offers comprehensive data logging and interface features and there is a wide choice of compatible software to store, analyse and present your weather data, both locally and on web pages.
However, if you’re a new user then don’t get overwhelmed! The basics are actually straightforward and not at all difficult to set up, especially with the simpler loggers uploading to online platforms like the WiFi logger or devices such as the Weatherlink Live. It’s easy enough to choose to start off with one of these simpler units uploading to a platform like Davis’s weatherlink.com cloud platform or others such as the UK Met Office’s WOW system or Weathercloud and then to move to a more customised set-up at a later date as your knowledge and experience grows.
This overview page, together with a couple of further pages linked to below, should provide all the introduction that new users will need. This section first summarises what’s possible with a modern data logger, followed by a brief description of the logger hardware and features and, in the final section below, a short introduction to weather station software. There is also an examples page that shows a number of illustrations of the diverse data presentations that can easily be created on local PC displays and on websites; and pages that summarise the features available with different logger types such as Weatherlink Live or the various Davis-compatible loggers.
The range of capabilities provided by a Davis Weatherlink logger or related device or cellular gateway includes:
- Customisable real-time displays of current weather conditions on local PC (or Mac etc) monitors and large screens;
- Automatic long-term logging of detailed weather records, allowing high-resolution archives of weather data to accumulate over months and years. The logger will store data for extended periods before download to a computer is necessary;
- Analysis of logged data (eg to generate monthly summary reports) and graphical presentation of data on time-scales ranging from hours to months in visually impressive charts;
- Real-time (every minute) uploads of data to cloud platforms such as the Davis weatherlink.com service from where current weather conditions can be viewed literally worldwide across the Internet on smart-phones, tablets via apps and in web browsers on every type of computer device;
- Sending alarm/alert messages (eg by email or SMS) and control of external electrical equipment such as heating and ventilating systems in response to changing weather conditions;Any of the above three capabilities may be implemented using long distance data links and/or on websites;
- Operation at remote sites: The Davis Vantage connect and Enviromonitor units are fully self-contained, solar-powered units that provide functionality similar to the Weatherlink logger and can upload data from fully remote sites using the mobile phone network;
Data loggers & upload devices
There are three classes of device that can pass weather data to a local computer and/or to an Internet service on the web:
- Traditional data loggers and related third-party devices;
- The Davis Weatherlink Live unit, which is described in detail here;
- Solar-powered gateway devices such as Vantage Connect and Enviromonitor gateways that connect to the mobile (cellular) phone network and that are intended for use at remote field sites;
The standard or traditional data logger is typically what new users might be most familiar with and is also good background to understand the various third-party loggers, so the notes below explain more about this class of loggers. But Weatherlink Live is also a good option for new users and worth reading up on too. Cellular gateways are more of a specialist item for eg the agricultural sector but the linked pages provide good background material if these are relevant to your application.
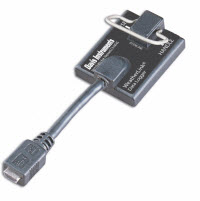
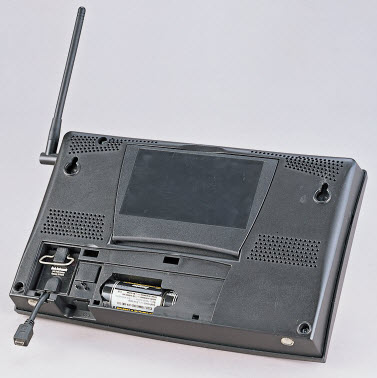 For Davis stations, the traditional logger is typically a relatively small module that fits into a recess on the lower rear of the display console unit. (See close-up logger image left and installed into a VP2 console right.) Once installed, the logger effectively becomes part of the console.
Data loggers for most of the weather stations we sell can perform two distinct roles in generating real-time and archive data. It’s worth appreciating the difference between these two roles because it makes understanding how best to use the loggers in different applications much clearer. (But don’t worry if this explanation isn’t crystal-clear at first sight – most logging configurations are relatively easy to set up and don’t necessarily require behind-the-scenes knowledge; the screen-shots on the examples page will quickly show the range of possibities):
- Real-time data feeds: The logger provides an interface to a PC which allows real-time data (ie readings refreshed every few seconds) to be accessed by programs running on the linked PC. It’s this type of data feed that will be used to provide real-time weather displays on PC monitors, websites etc. Typically, this real-time data is transient and not stored at all by the logger – ie if a linked PC is not listening in when the latest data refresh is available then that data record will be lost.
- Archive data logging (also termed true data logging): In this role the logger receives data either direct from the weather sensors or – more commonly – after initial processing of the raw weather data by the display console and then automatically stores summary values for the various weather sensor readings at preset intervals, for example every minute or 10 minutes or every hour. In this way, the data logger can accumulate a complete and detailed history of weather conditions over a period – potentially up to a week or a month or even more, depending on the type and capacity of the logger. This archive of summarised data remains stored in the data logger until it is connected to a computer and a program requests a download of the archive (which may be just a partial download, ie of any new data that has not previously been downloaded).
All Davis loggers are clever enough to be able to perform both of these roles simultaneously, if required to do so.
There can be a further twist to these archive/real-time roles. Some logging systems using third-party software programs are set up with a PC constantly switched on and listening to the real-time data. In these systems, it’s the PC program and not the logger that processes the real-time data stream and summarises it to generate the archive data. Not surprisingly, the format in which the archive data is stored on the PC’s hard drive will depend on the processing program being used.
Davis is somewhat unusual as a manufacturer of weather stations by providing a complete range of loggers with different features, all Davis loggers bearing the family name Weatherlink . Because the Davis logger is a separate part from the weather station console, this allows users to specify the station and logger types independently and thereby to tailor a PC-linked weather station system to meet their exact requirements.
The cheapest and most popular Weatherlink logger nowadays is the part with a USB interface (6510USB) to connect to a PC or laptop. A similar logger is also available with a serial/RS232 interface (6510SER), which some customers still prefer in certain circumstances. These two loggers are described on our main Weatherlink page.
In addition to the standard USB and serial Weatherlink loggers, there are also other advanced Davis and compatible third-party devices, which offer important further data-handling features in addition to the archive and real-time data roles. Details of these can be found on the following specific product pages:
- A new Davis Weatherlink Live (WLL) device is now readily available and is rapidly becoming the most popular computer interface for Davis stations. WLL’s primary role is to provide more powerful uploads to the Davis weatherlink.com platform and it will supersede the WeatherlinkIP logger, but WLL also has other important new features such as the capability to connect into local networks via WiFi;
- A device known simply as the WiFi Logger is an inexpensive third-party logger which resembles the WeatherlinkIP logger in network capabilities and, as its name suggests, passes data via WiFi. The WiFi logger is also able to upload data to a number of online weather networks;
- WiFiLogger can connect to all 2.4GHz networks (b/g/n) but please note that it cannot connect to 5GHz networks (because there is no suitable WiFi module available for building into WFL that also supports 5GHz, so this is effectively a limitation of chip supply rather than WFL design).
- Nano and Nano SD are also third-party loggers with a similar form factor to the WeatherlinkIP logger. These provide network connectivity via WiFi and make the range of Meteobridge features available in a very compact package. Nano is a more powerful but also more costly alternative to the WiFi logger. (The Meteobridge family also includes the Meteobridge Pro Red unit, which provides a complete alternative to a console+logger combination);
- Meteo-Pi is an inexpensive device for linking a Davis console directly to a Raspberry Pi computer;
- The Vantage Connect unit is the ultimate in integration for remote weather monitoring. This unit combines the functionality of the WeatherlinkIP logger with a mobile phone modem and solar panel power supply. The resulting system can be placed in an open field literally anywhere that has mobile reception and will report back live data automatically to the central server at www.weatherlink.com from where the data may be viewed in a standard web browser worldwide.
- For completeness we should also mention the Davis Enviromonitor(EM) system. This is not a small logger, but a complete alternative to eg a Vantage Pro 2 system, providing a very powerful multi-sensor system that uploads data from remote locations to the weatherlink.com platform. Enviromonitor is primarily aimed at enterprises such as larger farms, though its ability to accept inputs from many sensor types makes it suitable for a wide range of applications;
NB The old WeatherlinkIP logger was a network logger with a cabled Ethernet interface but is now discontinued. It has effectively been superseded by the WiFi and Meteo-Pi Ethernet loggers, which is probably the most cost-effective alternative or by the Weatherlink Live device.
Also, for anyone to whom this might be of interest, we are able to source a Modbus interface to the standard Davis 6510SER serial logger – please see the page on Modbus Accessories for further details.
Weather station software
There are two main approaches to storing, displaying and reviewing data that your weather station collects:
- Connect a data logger to a PC or similar local computer and use software running on that computer to handle the data;
- Use an online weather network such as the Davis weatherlink.com platform or Weather Underground as your primary means of viewing and analysing the data. (Of course your weather data still has to reach the online server or service and so some sort of upload device is always required, but this can be much simpler than running a full local computer);
These two approaches are not mutually exclusive. So, many users will run a local computer as their primary means of data handling, but local software will also be able to upload data either to the user’s own website or to one of the online weather platforms such as weatherlink.com platform or Weather Underground. And, conversely, some types of logger, especially the Nano SD unit, have sufficient software functionality built-in to perform many of the common local data-handling tasks, as well as being able to upload to online servers and platforms.
There is no shortage of choice when it comes to choosing logger type and software, but it’s helpful to consider whether viewing data locally is your main requirement or if seeing data online is the priority or, as a further option, if you would prefer to have both online and local data views available.
Local software
This section introduces software for weather stations that runs on a PC or similar local computer. It assumes that the data logger will, typically, be cabled to a PC (or in the case the case of a logger with an Ethernet interface such as the WeatherlinkIP logger, cabled to a network access point with communications to the PC possible via the network).
Software running on the PC can then control a whole range of possible presentations of weather data, the three most common applications being a real-time graphical display of current weather conditions; a summary of the data over a period of time (eg a calendar month) in text or chart form; and managing an automatically-updating weather website on a remote web server.
The data feeds from a logger are often in a specialised data format and so it’s important that the software can decode the data as required – so compatibility with each particular type of logger is required. Typically, the data loggers cannot (but with certain exceptions) output in either plain text format or in complete web pages – a computer is generally needed to create the final display at some point between the logger and the display.
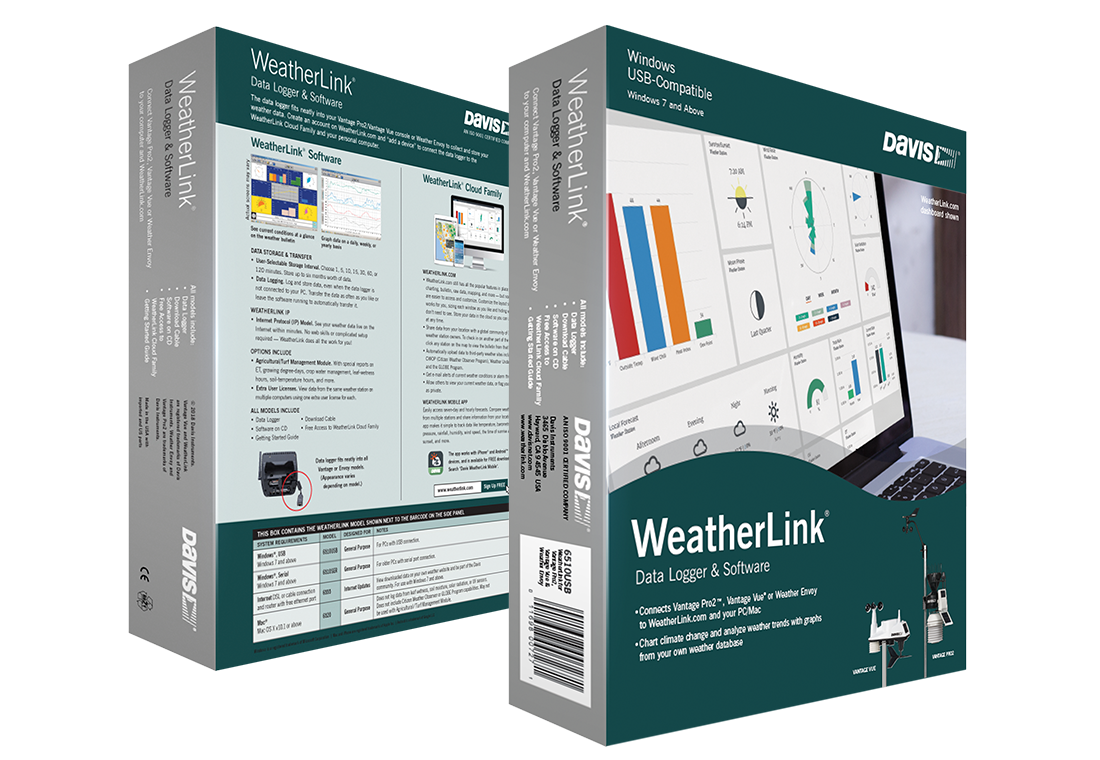 The best-known program available for use with the Davis stations and loggers is Davis’s own Weatherlink program, which is supplied as a standard part of the Weatherlink pack and so every logger purchaser also gets a ‘free’ copy of the Davis software – it is not necessary to specify software separately, unless you wish to use a third-party program. (‘Weatherlink’, perhaps a little confusingly, is the name used by Davis for the logger itself, their own processing program and also the standard pack containing both of these items.)
So many Davis VP-family stations have been sold worldwide since 2001 that an active market has developed in third-party programs that are compatible with the Davis loggers, with the result that there’s a wide choice of programs, including Weatherlink itself of course.
We’re often asked about which program is the best to use, but this isn’t an easy question to answer – each of the alternative programs to Weatherlink has its own features and pros and cons (summarised on our compatible software page and illustrated on the examples page) – and so it really depends on your own requirements and priorities. We generally recommend looking at the Weatherlink program itself to start with – you get a copy free with every Davis logger and it’s perhaps the most professionally produced and most widely used of all the programs. But it’s not as fully-featured as say Weather Display or Cumulus, nor is its real-time display as attractive as Weather Display Live or the SteelSeries gauges. Cumulus is attracting a lot of new users because of its balance of features, ease-of-use and clarity, plus it’s free to download.
Most Davis station owners run Windows on their PCs and so inevitably the great bulk of the Weatherlink and third-party program development has focused on Windows software versions. However, both the Weatherlink program and certain other programs are available in a Mac version and Linux versions of a few third-party programs are also starting to appear. If at all possible, we recommend using Windows software – simply because the vastly larger user-base of Windows versions means that these programs offer more features and flexibility. Read more about Windows vs Mac weather station software.
Buy Now