Introduction
One of the major benefits now available with affordable automatic weather stations such as the Davis systems is that the weather data can be processed automatically by computer and viewed on both local PC displays and, if you wish, on websites.
 How far you take this process is very much up to you. Some users are content with simply keeping a comprehensive archive of their weather data on their own PC for future reference. (We’re using ‘PC’ as shorthand for any type of compatible computer, including Macs, Linux computers etc. All types are compatible in principle with our weather stations, although there are several advantages in practice to choosing a Windows PC.)
Other users may be more ambitious and take full advantage of the power that modern software and web servers provide to create visually impressive, real-time presentations of their weather data on web pages that may be viewed from anywhere in the world. Click on the right-hand image here to see a live example of a website image – this example is generated by a 6555 WeatherlinkIP logger uploading to the Davis weatherlink.com website and is surprisingly easy to set up.
To connect a station to a PC requires two items: the data logger hardware, which provides the physical connection to the PC; and weather station software to run on the PC, which receives the data from the logger and manages the storage, display and uploading of weather data on the PC.
Please note: All the weather stations we sell require a separate data logger pack to connect the station to a computer – you cannot connect the console unit direct to a PC. This arrangement does allow maximum flexibility in allowing you to pick the type of connection that you prefer and, for anyone who does not need to connect to a PC, means that you’re not paying for a feature that you will not be using.
But if you are intending to use a PC then be sure also to order a data logger pack. (We do have special bundles of station plus logger available throughout the Davis range, which offer a considerable discount on the logger list price.) Note that the Davis logger is a true data logger and can store data for extended periods, for example while you’re away on holiday, for later download to a PC.
Logger benefits and features
Adding a data logger to a weather station provides four main benefits:
- Automatic long-term logging of detailed weather records;
- Real-time displays of current weather conditions on PC (or Mac) monitors and large screens;
- Summarising past weather data in monthly reports and charting data automatically on time-scales ranging from hours to months;
- Running live weather-reporting websites;
The Data Logger
 The logger for Davis stations is known as a Weatherlink logger (Weatherlink is the brand-name that Davis give to all aspects of PC connection, including both logger hardware and software). There are several different logger types available, the most popular being the version with a USB connection to the PC, and the whole range of loggers will fit all Davis station models. The notes below describe the Weatherlink loggers but the same principles also typically apply to other makes of weather station.
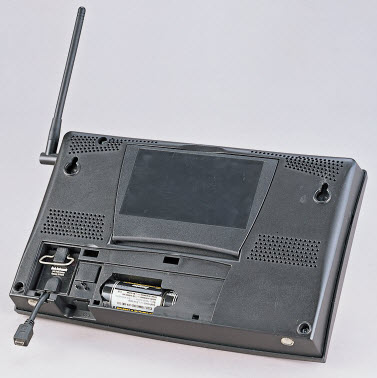
On the Davis stations, the logger is a small module that fits into a recess on the lower rear of the display console unit. (See close-up logger image left and installed into a VP2 console right.) Once installed, the logger effectively becomes part of the console.
Typically, the logger will be cabled to a PC and then software running on the PC will store the data and generate various displays of the weather readings. If you wish, web pages can also be uploaded from the PC to a website.
The 6510USB version of the logger is the most popular, but a version with serial/RS232 interface is also available, both of these types being supplied with Windows software. The USB version is also available with Mac software.
The 6555 Davis WeatherlinkIP logger is a special case in that it does not need to be connected to a PC. This 6555 IP logger can cable directly to an Ethernet network access point and is able to upload webpage data directly to the website at www.weatherlink.com as per the example at the top of this page, with no further charge beyond the initial purchase price. (Uploads to weatherlink.com can also be made using the standard Weatherlink for Windows software running on a PC, but in this case there is a small annual subscription charge.)
Weather station software
Each Davis Weatherlink logger pack is supplied with a free Weatherlink software CD. The WL software is good, robust software and meets the requirements of many users. It is limited, however, in certain respects and a thriving marketplace in third-party software – some free, other packages costing up to £50 – compatible with the WL loggers has grown up, two widely-used examples being Cumulus and Weather Display.
To understand what weather software can deliver, it helps to know that two distinct types of data can be passed from the logger to the PC:
- Real-time data: This is generated every 2-3 seconds and contains, for example, the very latest wind speed and direction readings. This is transient data that is not stored at all in the logger; if not captured by the attached PC, it is lost.
- Summary (or archive) data: The logger is continuously calculating summary data records and at preset intervals (e.g. every 10 minutes) it will store a new data record in the logger’s memory until such time as a PC requests a download of all recent summary data to the PC, which can be any reasonable time, e.g. an hour, a day, a week etc until the logger’s capacity is reached;
This distinction between real-time and summary is then also seen in the the screens that the software generates: a real-time display which shows what the weather is doing right now (and updated every few seconds) and which effectively displays the real-time data; and a more retrospective display which focuses more on a summary of recent or past weather and which will typically be based primarily on the archive data.
When weather data is displayed on a web page, the presentation is created in a technically different way. Web page displays tend therefore to look rather different from the local PC displays. We’ve included below four example illustrations here of what is possible, comprising two local PC displays (generated by Weatherlink and by Cumulus respectively) and two website presentations (from Weatherlink again and from a third-party program called Weather Display Live). If you click on the smaller images shown you’ll see:
- for the local PC displays a larger version of the same static image (but still smaller than it would appear on a live PC);
- for the web page displays, a link through to a live web page showing current weather conditions at an illustrative location;
Weatherlink real-time local PC display
 This shows the real-time display generated by the free Weatherlink software on a local Windows PC (what is called ‘Bulletin’ mode in Weatherlink). This example shows data from a Vantage Pro 2 Plus station which has the optional solar and UV sensors fitted and showing data in the two yellow-background panels on the bottom row. On a standard Vue or VP2 station these two panels would not be present, with the overall disply reformatted somewhat.
Cumulus real-time local PC display
 This shows the equivalent real-time display to the Weatherlink example above, but generated here by the third-party Cumulus software. You can see that more of the data is presented as text readings here rather than the more colourful graphics of Weatherlink, although this does allow more information to be shown overall.
Weatherlink web-page display
 Here is the web-page data presentation generated by the standard webpage template supplied free with the Weatherlink software. This page updates automatically every 5 minutes and contains:
- Various highs and lows as text values down the left-hand side;
- Graphic elements showing current readings for temperature, wind, rain etc;
- A single example of a trend graph, showing pressure in this instance;
What is shown here is the default template. Anyone who knows a little about web page design can easily adapt this layout according to their own preferences or indeed create their own layout from scratch.
(NB This web page uses Java to create the scrolling ticker display at the top of the page. In common with all such use of Java, this may trigger a security alert on a modern browser. This page is safe to view, but if you’re uncomfortable doing so then just say no to the alert – the rest of page will all display correctly apart from this ticker element.)
In addition to this locally-generated and template-driven web page, all copies of v6 of the Weatherlink software can be used in conjunction with an inexpensive subscription to upload data to the worldwide community at www.weatherlink.com and to generate a live weather website similar to the example right at the top of this page. (Click on the blue-sky image to see the live web page.) The 6555 WeatherlinkIP logger version will also generate the same web presentation and without needing a local PC at all.
Weather Display Live web-page display
 This is an example of a more advanced weather web page. This is generated by the Weather Display third-party software, used in conjunction with the Weather Display Live add-on.
If you click on the image to the left and watch the resulting display for a couple of minutes you’ll see that this is close to a real-time webpage display – the wind speed and direction dials should be flicking every 10 seconds or so (unless it’s a calm day of course) with the latest wind readings.
Achieving this display is not difficult for anyone with some familiarity with setting up Windows software, but it does require buying the third-party software used (though a 30-day free trail is available) and then working through the configuration process.
Read more
This page is simply an initial introduction to the whole topic of connecting a weather station to a PC or Mac and the associated software. To find out more, please see the main data logger introductory page for much more detail and read on from there or look at the various submenus in the Data Loggers & Software section of our main Products menu.